


Key Takeaways
- Our model covers 16 U.S. sectors, 83.6 million predominantly white-collar workers, 1,199 significant roles and 5,995 sector-specific tasks, representing roughly 93% of headcount across the sectors in scope.
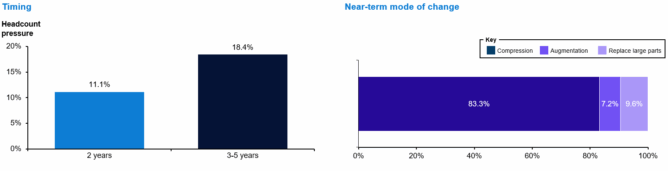
- The near-term labor story is compression, not wholesale replacement. We estimate 11.1% modeled headcount pressure at two years, rising to 18.4% over three to five years. That translates to roughly $601B of near-term labor spend at risk and $996B over three to five years.
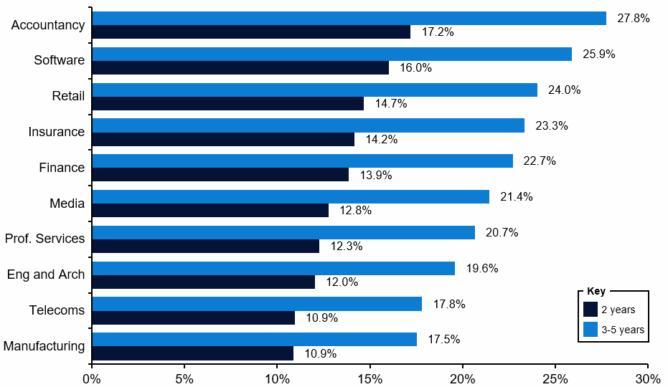
- On a percentage basis, the sectors with the highest near-term headcount pressure are Accountancy (17.2%), Software (16.0%), Retail (14.7%), Insurance (14.2%) and Finance (13.9%).
- On an absolute basis, the biggest hidden exposure sits in Retail (2.3M workers under modeled pressure at two years), Healthcare (1.5M) and Manufacturing (1.4M). By labor spend at risk, the leaders are Healthcare ($98.8B), Retail ($94.7B) and Manufacturing ($88.0B).
- The underappreciated story is that these changes are not just for software engineers or media workers. It is the amount of economically important work that is really administrative workflow in disguise: intake, scheduling, claims, documentation, routing, reconciliation, records handling, reporting, customer support and exception management.
Anthropic’s recent buzzy labor market publication moved the debate forward. But occupation-level analysis is still too blunt for investors and management teams to take action on.
The most important AI labor story may be hiding in plain sight. Recently, Anthropic published a report covering the theoretical vs observed usage of AI across a variety of standard job roles. Its contribution was to look at “observed exposure,” the overlap between tasks frontier models appear capable of performing and the work people are already using AI to help with on the job. The headline was more restrained than much of the public AI narrative that followed it: so far, the evidence points to limited broad unemployment effects rather than immediate mass displacement.
This work is useful and opens the door to a deeper layer of analysis. Companies do not organize themselves around occupation labels. They organize around sectors, workflows, operating models, roles, systems and repeatable jobs to be done. A customer service job inside an insurer is not the same job as customer service inside a hospital, a telecom operator or a bank.
In the token economy, value capture starts to migrate toward AI agents consuming tokens that are embedded inside recurring workflows. This means the first visible pressure shows up where work can be codified, routed, reviewed and integrated into existing systems.
Exhibit 1: The model in Numbers
A workflow view of scale, timing, and mode - before the sector detail begins
In our work presented over the following pages, we take the question Anthropic helped raise and push it one layer deeper into industry-specific workflows. Across 16 U.S. sectors covering 83.6 million workers, we find that the biggest hidden exposure sits not only in the obvious AI roles, but in the administrative machinery of large industries: scheduling, claims, documentation, reconciliation, reporting, servicing and coordination work. In the agent and token economy, that is where value capture starts to migrate first, into recurring workflows that can be codified, routed, reviewed and embedded into systems of record.
Hidden Exposure Is Not The Same As Percentage Exposure
The first big takeaway is that percentage exposure and hidden economic exposure are altogether different stories.
On a per-sector basis, the fastest near-term headcount pressure sits in Accountancy, Software, Retail, Insurance and Finance. These sectors are especially dense with work that is digital, repetitive, document-heavy and already embedded in systems.
Exhibit 2: The highest near-term headcount pressure is concentrated in admin-dense sectors

Modeled headcount pressure
Percent of sector headcount under modeled pressure. The first-order effect is slower hiring and support-layer compression rather than mass displacement
But the picture changes when you ask where the most workers and most labor spend sit.
Because some sectors are simply much larger, the biggest pockets of hidden exposure are Retail, Healthcare and Manufacturing. Retail leads on modeled workers under pressure at two years with 2.3 million, followed by Healthcare at 1.5 million and Manufacturing at 1.4 million. By labor spend at risk, Healthcare leads at $98.8B, followed by Retail at $94.7B and Manufacturing at $88.0B.
Exhibit 3: Percentage exposure and hidden economic exposure are different stories
2-year labor spend at risk ($bn)
2-year modeled headcount pressure
Software, accountancy, finande and insurance lead on percentage pressure. Retail, healthcare and manufacturing dominate on absolute scale
This distinction matters for management teams and investors. Software is a top-tier exposure story on a per-worker basis, but some of the largest economic exposure comes from sectors that operate at enormous scale. The sectors with the biggest hidden exposure are often not the ones that dominate the public AI narrative. They are the ones with the thickest layers of operational and administrative workflow around the core work – from claims and scheduling in healthcare to inventory, customer support, merchandising and logistics coordination in retail.
Exhibit 4: Retail, healthcare and manufacturing carry the largest absolute headcount pressure
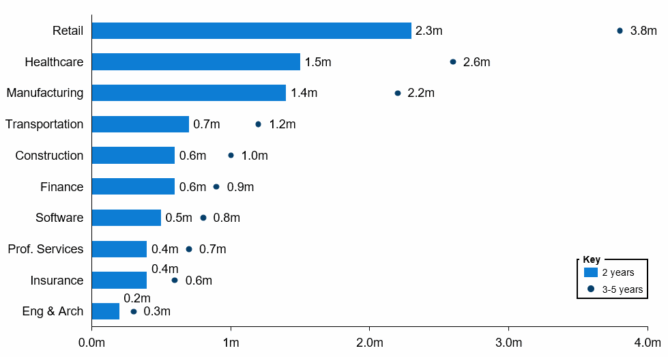
Workers under modeled pressure (m)
These are modeled workers in roles under pressure, not forecast layoffs. The five-year marker shows how quickly pressure broadens in large sectors
Compression Comes Before Replacement
The second big takeaway is that the near-term effect is mostly compression of work inside jobs, not wholesale elimination of jobs.
In our model, 83.3% of headcount sits in compression-oriented roles, where AI reduces the amount of labor needed inside existing workflows; 7.2% sits in augmentation-oriented roles, where AI primarily improves worker productivity without materially reducing headcount; and 9.6% sits in roles where AI could replace large portions of the underlying work altogether.
In practice, that means the first visible effects are more likely to be slower hiring, lower backfill, smaller support teams, broader manager spans and more output per coordinator or analyst than immediate mass layoffs.
Where does that pressure show up first? In broad role-family terms, it lands hardest in administrative support, finance and control, customer-facing operational work, software and IT and project, program and advisory workflows. It moves much more slowly in field execution, clinical work and other roles whose core value depends on physical action, trust or messy real-world exceptions.
Exhibit 5: Administrative, finance-control, customer and software workflows move first
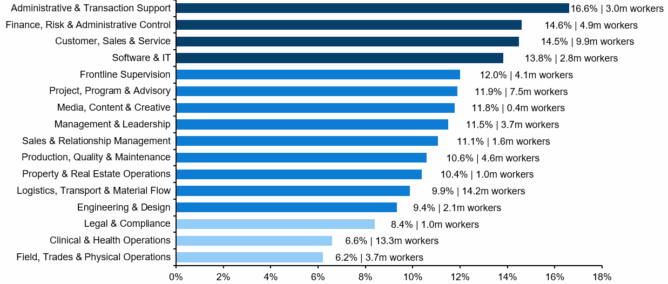
2-year modeled headcount pressure
Exposure is highest where work is digitized, repetitive, document-heavy or queue-based. Physical, clinical and frontline execution layers move more slowly
This is the core reason the public debate often misses the hidden exposure. The first-order story is not “white collar versus blue collar.” It is workflow structure. Work moves faster when it is instrumented, reviewable, repetitive and attached to a queue or document flow. Much of this exposure currently sits within digitally mediated knowledge work.
Support Layers Move First; Frontline Execution Is Stickier
Two interesting areas to consider are healthcare and construction.
Healthcare is not a single AI story. Administration moves first; direct clinical work moves more slowly. Intake, scheduling, billing, records, service coordination and revenue-cycle-adjacent workflows are much more exposed than bedside and direct-care workflows.
Exhibit 6: In healthcare, administration moves first and direct clinical work moves slower
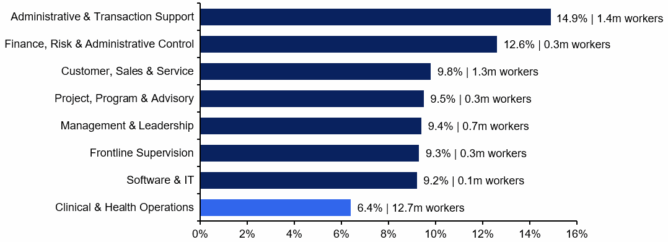
2-year modeled headcount pressure
The V3 patch sharpened this split: intake, scheduling, billing and records functions move much faster than bedside and direct-care workflows
Construction shows a similar pattern in a different form. The exposed work is not the trade labor on the job site; it is the layer around it: estimating, project coordination, documentation, scheduling and procurement support. That is why administrative and project workflows move faster than field execution.
Exhibit 7: In construction, project admin moves faster than field execution
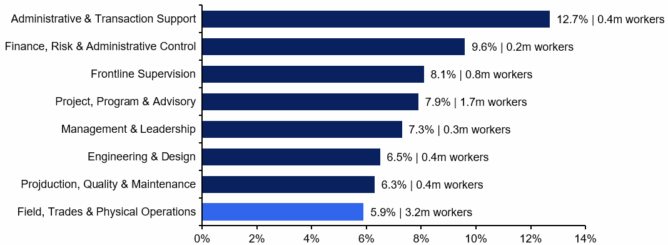
2-year modeled headcount pressure
Estimating, planning, scheduling, documentation and procurement support are materially more exposed than trade labor on the job site
Professional services sit somewhere in between. The work itself remains relationship-heavy and accountability-heavy, which slows large headcount moves. But the workflows around research, drafting, coordination and admin support are still very compressible. That is why the software layer can come under pressure before partner or client-facing labor does.
Software Disruption Is Not A Side Effect Of Labor Changes — It Is Its Own Story
The shift to the token economy changes the software stack as much as it changes labor. This has been clear to investors for the last six months as we unwound two trillion dollars of enterprise value in the recent software sector repricing.
Exhibit 8: Software asset classes ranked by five-year workflow exposure base
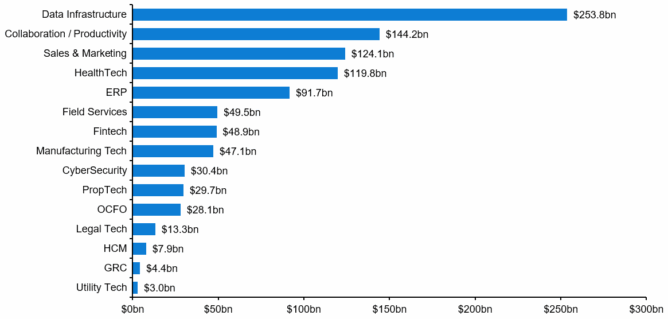
Mapped labor spend at risk over 3-5 years ($bn)
For software investors, the relevant question is not whether AI is good or bad for software in the abstract. We think the better question is which software categories sit on workflows that lose human touches, and which become more strategic because they act as the systems, data layers, and control points through which AI-driven workflows operate.
The first bucket is the clearest seat-and-workflow compression story. In these classes, the first effect is fewer clicks, fewer handoffs, fewer seats per workflow and more work completed inside AI-assisted flows rather than inside standalone applications.
The second bucket is pressure plus control-point resilience. These are the systems AI must plug into: data layers, orchestration points, dispatch and work-order systems, core transaction systems and operational records. In these classes, the risk is less about software spends disappearing outright and more about architecture shifts, vendor consolidation and battles over who owns automation, monitoring and exception handling.
The third bucket is the vertical and regulated workflow stack. These classes are exposed because drafting, reconciliation, review and coordination work compress. But they are also defended by compliance, audit trail, approval logic and system-of-record stickiness.
Cybersecurity and governance, risk, and compliance (GRC) deserve a separate note. They do not show up as the largest compression buckets in this workflow-led remap, but we think the current model likely understates their potential as beneficiaries. The model measures pressure around existing labor workflows. It does not fully capture net-new spend on identity, permissions, monitoring, auditability, policy and AI governance as agents get embedded into live processes.
Exhibit 9: Software classes split between compression risk and control-point resilience
Control-point offset proxy / risk ratio
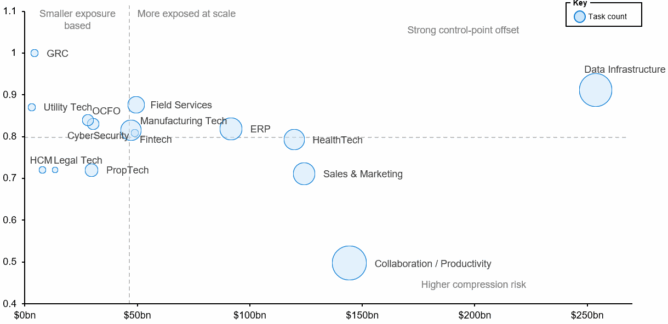
5-year workflow exposure based ($bn)
So, what do we think is going to happen? Broadly, we expect that:
- The first software categories likely to experience commercial pressure are seat-heavy workflow layers.
- The more resilient or advantaged classes are the systems of record, data and orchestration layers and control planes that AI has to sit on top of.
That is why some companies will feel AI first through payroll pressure, others through shrinking software seat counts, and others through competition over who controls the workflow once tokens become the new unit of work.
The Broader Point
The industries most exposed to AI are not simply the ones with the most visible “AI jobs.” They are often the ones with the greatest concentration of disruptable workflows. Those workflows are frequently hidden in plain sight inside the administrative systems that keep sectors running.
That is why the ranking changes when you move from occupations to sectors, and from job titles to jobs to be done. It is also why the downstream effects look uneven. In some sectors, the first visible change will be in hiring and backfill. In others, it will be in seat counts, software architecture or manager spans. The real unit of change is the job mix inside an industry.
That leaves management teams and investors with a better set of questions than the generic question of whether AI “matters:”
- Which parts of our business are built on dense administrative workflows rather than on the core expertise we like to talk about?
- Where is AI most likely to appear first through slower hiring, lower backfill and smaller support teams rather than layoffs?
- Which roles are genuinely more likely to be augmented than compressed?
- Which software categories around exposed workflows are likely to lose relevance first?
- Where does apparent exposure remain blocked by trust, regulation, physical work, fragmented systems or messy exceptions?
Those questions are harder than occupation-level rankings. They are also much more useful.
Over the following weeks, we will be publishing deep dives into what this means for software, investors and the sector at large. Sign up to Teneo’s PE Growth newsletter to get early access to our research.
Sources & Method
This analysis is U.S.-only and uses the 2022 NAICS framework as the industry backbone. Occupational coverage is built primarily from BLS OEWS research estimates by state and industry, aggregated into U.S. sector slices for this work, with supporting use of BLS national industry-specific occupational employment and wage estimates where relevant. The model covers 16 selected sectors and approximately 93% of headcount within those sectors.
The workflow layer is an original synthesis. We normalized roles into reusable families, decomposed them into sector-specific tasks and translated those tasks into modeled headcount pressure, labor spend at risk and software category implications.
These numbers should be read as a structured benchmark of exposure and pressure, not as a precise forecast of layoffs. Modeled headcount pressure includes slower hiring, lower backfill, redesign and support-layer compression, not only job elimination.
Primary external sources:
1: Anthropic, Labor market impacts of AI: A new measure and early evidence - https://www.anthropic.com/research/labor-market-impact
2: U.S. Bureau of Labor Statistics, May 2024 National Industry-Specific Occupational Employment and Wage Estimates- https://www.bls.gov/oes/2024/may/oessrci.htm
3: U.S. Bureau of Labor Statistics, OEWS Research Estimates by State and Industry - https://www.bls.gov/oes/current/oes_research_estimates.htm
4: U.S. Census Bureau, North American Industry Classification System (2022 NAICS) - https://www.census.gov/naics/